Three Pivots and What I Learned from Them

When the course of action you are on is no longer taking you where you want to go, it’s time to pivot to a new course. In a presentation to the Back End of Innovation conference last November, I shared how I pivoted at three key points in my career, and the lessons you can learn from my experience to help you pivot toward successful innovation.

Early in my career, as a software development coach, the head of development at a client company asked me an interesting question: “Somik, your Agile methodology has been very successful in bringing projects to completion on time, on budget, with zero defects. But we have far more projects than we can afford to do. Can Agile help us pick the right ones to fund?” I had to say “no”–but that got me thinking, and eventually prompted me to return to school and earn a doctorate in Decision Analysis, the only field of study that concretely answers this question. Along the way, I realized you can’t measure the value of innovation, but you can use metrics to pivot productively. For example, counting how many times a day you brush your teeth doesn’t measure dental health, but it does ensure that you do things to promote dental health.
In 2011, I joined a non-profit to apply my work in using values in decisions. I built them a massive mathematical model to assess the value of preserving the Amazon rainforest. However, the model was so complex that no one but me could use it! Later, when I joined SmartOrg, I got a second chance at the problem on a project for another conservation group, helping them choose the best projects to pursue. Here, I pivoted to a simpler model, but it still contained a complex multi-attribute value metric that had no natural interpretation. The regional division we worked with was able to use the output of the model, but the value metric hindered their use of the model. Fortunately, we got the opportunity to work for another regional division, and this time, I completed my first pivot to very simple value metrics that captured critical impact tradeoffs for each project through a natural interpretation. To my delight, the conservation group understood the output of the model and used it to drive the conversation on who they wanted to be. I learned that the purpose of quantitative analysis is to take complexity off the table, so that you can focus on who you want to be.
vp tornado diagram
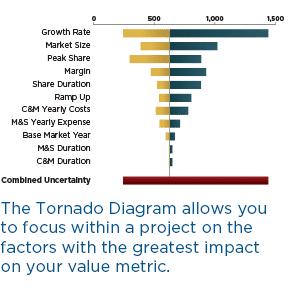
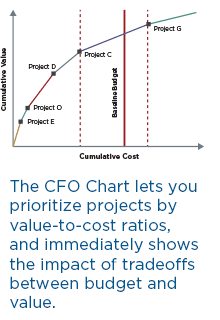
The Tornado diagram helps product teams reduce complexity and pivot effectively.My second pivot centered on the development of SmartOrg’s core portfolio management platform. We had more features that we wanted to add to the product than we had the capacity to develop. This led to a lot of contention and head-butting with my executives over getting all of the features done in a short time frame, without sufficient thought to how to prioritize and sequence them. My breakthrough came when I realized that this was not a resourcing problem, but a communication problem with our executives who needed transparency on value-cost tradeoffs. I developed a framework to describe each feature in terms of its value to current and future customers, its cost and its development timeframe. After I had done the work to make value-cost tradeoffs evident, I learned that our executives did “get” innovation. They just needed a transparent way to understand the tradeoffs so they could support pivoting decisions.
Generally, the CFO Chart (Article source: The FP&A Question From Hell) helps organizations make their value-cost tradeoffs transparent. This didn’t mean all contention disappeared. Our first version of our product’s web interface was slow and antiquated, barely adequate to the customers’ needs. My development team demonstrated a replacement user interface that was faster, responsive and more functional, but before we could complete it, we came up on a deadline to deploy the old interface in order to meet payment milestones. This was a classic finance vs. innovation conflict, and it led to an insight that we needed the innovation (the new platform) to be more mature so we could satisfy the needs of finance. My third pivot was to align innovation with financial reality by decoupling the user interface from the back-end via an API. When offered this non-disruptive alternative, finance gave us the green light to develop the new interface in parallel while keeping the old interface functional. I learned that finance will support Innovation if the strategy accounts for financial reality and the maturity of the innovation.
vp cfo chart

Generally, the Innovation Screen is a great tool that helps organizations map their projects/products based on maturity so they can be appropriately aligned with finance.