Big Growth Goals

In the February 2018 edition of ValuePoint, I discussed opportunity cost in your innovation portfolio. Because of scarcity of resources, it’s rare that an organization can vigorously pursue all of the innovation opportunities it comes up with. But organizational FOMO (Fear Of Missing Out) can make it difficult for an innovation portfolio manager to choose which projects to pursue and which ones to set aside.

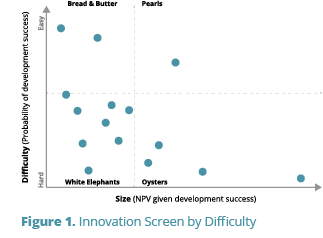
SmartOrg uses several tools to compare projects by cost, difficulty, and potential return. Two of these tools help to compare projects on a fair footing to identify the optimal portfolio mix: the Innovation Screen by Difficulty and the Innovation Screen by Time.

Each opportunity requires technical resources such as engineering and marketing hours, and each opportunity has characteristics that affect the probability that it will successfully yield new revenue. Projects in an innovation portfolio can be rated on a difficulty scale from easy to hard, based on the estimated probability that the development will be successful. Easy means either there are fewer proof points (see this article) required to demonstrate success, or the proof points already have evidence for success. Difficulty level and effort level are two different things: an easy project with a high probability of success may still take a lot of time and money.

If difficulty is an estimate of the project’s risk, market-adjusted net present value (NPV) is an estimate of its reward. NPV (assuming the project is successfully developed) comes from a model of the project’s commercial impact: cost of goods sold, average selling price, unit volumes over time, etc. SmartOrg teaches its clients to incorporate ranges of uncertainty for each of these model factors and use Tornado Charts (see this article) to see both the market-adjusted NPV and the high and low ranges of value.

Plotting the difficulty against the market-adjusted NPV for each project in the innovation portfolio gives the Innovation Screen by Difficulty. At the top of the Innovation Screen by Difficulty are easy projects; at the bottom are difficult projects that may not pay off. To the left are projects with low NPV; to the right are projects with higher expected returns.
SmartOrg has named the four quadrants of the Innovation Screen by Difficulty:
  • Small, easy projects are the organization’s Bread and Butter
  • Small, difficult projects are White Elephants
  • Large, easy projects are Pearls
  • Large, difficult projects are Oysters (which may create Pearls)
vp fig innovation screen by difficulty
Oysters seem to be less desirable than Pearls, but appearances can be deceiving. While Pearls are reliable sources of high returns, it turns out that you need to cultivate a lot of Oysters to create the next crop of Pearls.
The resources you devote to pursuing White Elephant projects constitute the opportunity cost of not using those resources to create and cultivate Oysters. Examine each White Elephant project to determine if it can pivot to be a high-potential Oyster; if it can’t, cancel it and redirect those resources to other projects to increase the overall upside potential of the portfolio.
vp fig innovation screen by time
The second key tool is the Innovation Screen by Time. Some projects require a few months to turn R&D investment back into cash-generating innovations; others may take years. A small-return project that completes quickly frees up investment dollars for the next project: the quick turnaround boosts cumulative returns and generates the funds for new innovation investment. Conversely, a small-return project that ties up funding for years creates the opportunity cost of preventing you from conducting several small projects in the same span of time.
Plotting the time to maturity against the NPV for each project in the innovation portfolio gives the Innovation Screen by Time. At the top of the Innovation Screen by Time are projects that mature quickly; at the bottom are projects requiring a longer time to pay off. To the left are projects with low NPV; to the right are projects with higher expected returns.
SmartOrg has named the four quadrants of the Innovation Screen by Difficulty:
  • Small, fast projects are Rabbits
  • Small, slow projects are Snails
  • Large, slow projects are Tortoises
  • Large, fast projects are Racehorses

Investment dollars you devote to an innovation project get locked up until that project results in a product or feature that starts earning revenue. The longer the time to maturity, the longer those funds are locked up and unavailable to fund anything else. With all other things being equal, you want to fund Rabbits rather than Snails and Racehorses rather than Tortoises.
Using tools like the Innovation Screens and the Tornado Chart, you can identify which projects are worth pursuing and which ones should be set aside. In this way, you will boost the power of your portfolio to deliver breakthrough growth.

However, other things may not be equal. If a large project is a Tortoise (slow) but also a Pearl (easy), it may be more valuable than an equally large Racehorse that is a difficult Oyster. A guiding principle for using the Innovation Screen by Time is to try to speed up difficult projects by structuring them such that if they fail, they fail quickly. Failing quickly helps you avoid wasting more resources on a losing cause, and it gives you time to pivot to another approach or another project with a greater chance of success.