A company’s portfolio of innovation and new product development projects is its engine for growth. New products and product and technology innovations replace products that are at end of life, and they provide the company a way into expanded and new markets.
You expect your innovation portfolio to generate sizable future revenue growth. But will you achieve that growth target? Can you get more revenue with the same investment?
From sixteen years of analyzing innovation and new product development portfolios, SmartOrg knows that half of the growth your portfolio generates depends on how much you spend, and half on how you spend it. You already know how much you spend on innovation and new product development. SmartOrg can show you a way to measure whether you’re spending it on the right mix of projects.
We call this measurement Portfolio Power. It depends on two things: how many of the projects in your portfolio have large expected returns, and how many have a high chance of success. Amazingly, just these two factors can predict how much growth your portfolio is likely to generate, and how likely it is your portfolio will meet your growth goals.
Even better, the Portfolio Power assessment can give you guidance on where and how to adjust your portfolio to generate more revenue growth. You can use the analysis to drive effective conversations with project owners and corporate executives about which projects have the most growth potential and which ones don’t make sense.
Shawn Williams of Rogers Corporation shared with the course attendees his company’s experience with the method (which he helped to develop). Rogers has used the Portfolio Power concept to help decide which projects to cancel for lack of growth potential and which projects to pivot to increase their growth potential. The culmination of Rogers’s efforts has been a doubling of its Portfolio Power and a massive increase in both the average project value and the total value of the portfolio.
During a recent Stanford Executive Education course on strategic portfolio decision making, forty-five executives shared information about their growth goals and the innovation portfolios that they hoped would deliver that growth. The executives represented companies from small to very large: half fell into the range of $60 million to $4 billion in revenues, with the median size being $750 million.
The executives were asked how much growth they intended to deliver over five years. Half of them had targets in the range of 10 percent to 80 percent, with the median value being 25 percent. That is, the median target was to have revenues in year five to be 25 percent greater than in the current year.
SmartOrg led an exercise to estimate the chance that each executive’s portfolio would meet his or her growth goal. The result:
- 49 percent of the portfolios had less than a 15 percent chance of meeting the goal.
- 22 percent had a greater than 90 percent chance of meeting the goal.
- The remaining 29 percent fell in between, with a median of a 35% chance.
Clearly a substantial number of these executives need help in getting their portfolios to generate more growth. (And possibly some need help in setting more ambitious growth goals.)
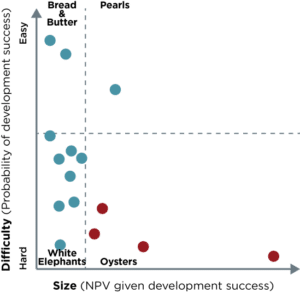
To determine these chances of success, SmartOrg helped the executives evaluate how their innovation resources are allocated. Each executive estimated the percentage of big projects – defined as ones that would contribute more than 5 percent growth if successful – in the portfolio. Then each executive estimated the percentage of projects that are easy – defined as having greater than a 50 percent chance of being successful.
From these two estimates, the executives calculated what percentage of projects in their portfolios fell into four categories:
- Small and Hard
- Small and Easy
- Big and Hard
- Big and Easy
It’s apparent that each of these types of project will contribute different average levels of growth to the overall portfolio. The big and easy projects generate large returns with low risk of failure. At the other extreme, small and hard projects are prone to failure and will only yield small returns if they do succeed. SmartOrg calculated historical average returns for each type. Smartorg uses a given portfolio’s project mix to create a weighted average return factor, which we call Portfolio Power.
Figure 1. A typical portfolio’s projects, distributed on the easy/hard and small/big axes

Portfolio Power is a measure of “where you spend it,” how well the portfolio’s resources are allocated to generate growth. Portfolio Power gives an estimate of the likely growth a portfolio will generate and of the chance of meeting the portfolio’s growth goal.
When the executives calculated their Portfolio Power numbers, the results were surprising:
- A quarter fell below 3.75.
- The median was 5.
- The top quartile was at 9 or above.
This means that half of the portfolios were weaker than one composed of only Small and Easy projects: the kind that provide reliable but mediocre returns. As the example of Rogers Corporation indicates, and as SmartOrg’s research experience confirms, most companies can easily make portfolio adjustments that can boost their portfolio power substantially – by a third or more.
Portfolio Power is a simple and very useful tool to evaluate the health of your innovation and new product development portfolio and to find areas where pivoting and refocusing can boost your chances of success. We developed a calculator to let you estimate your Portfolio Power. Try the calculator now to discover your portfolio’s growth potential. We’ll also send you a report on how your portfolio ranks among those in our research database.


