8.3 Release
In the 8.3 release, Portfolio Navigator answers the growth questions from the Board:
- How likely are we going to achieve our financial goal?
- Are the projects in the pipeline sufficient to meet the goal?
The newly added analytical capability such as goal analysis and difference waterfall, etc., helps the organization to set both conservative and aspirational goals and to identify key drivers to increase business value.
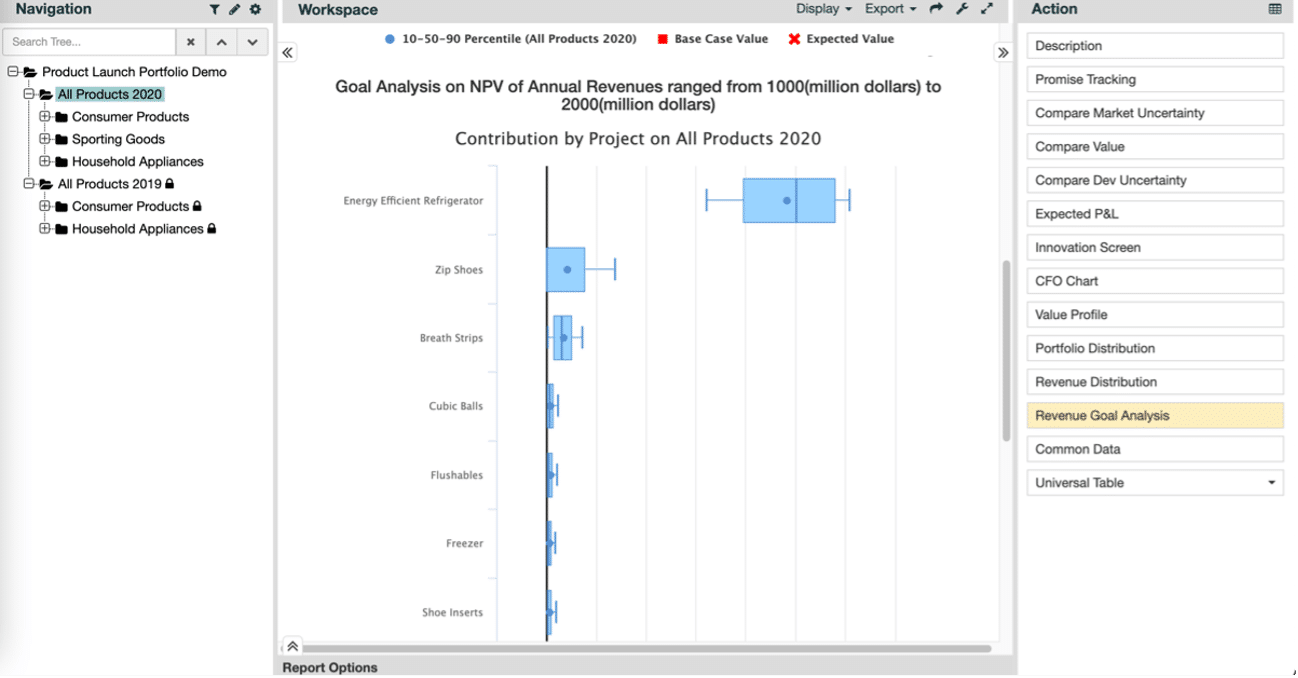
Goal Analysis
Say goodbye to a single point “correct” forecast.
You can now specify a goal, conservative or aspirational, in the context of uncertainty. Portfolio Navigator enables you and your team to plan and forecast around uncertainty, minimizing surprises at the end.
You will have two options to specify the goal, in value ($) or in value percentile (probability).
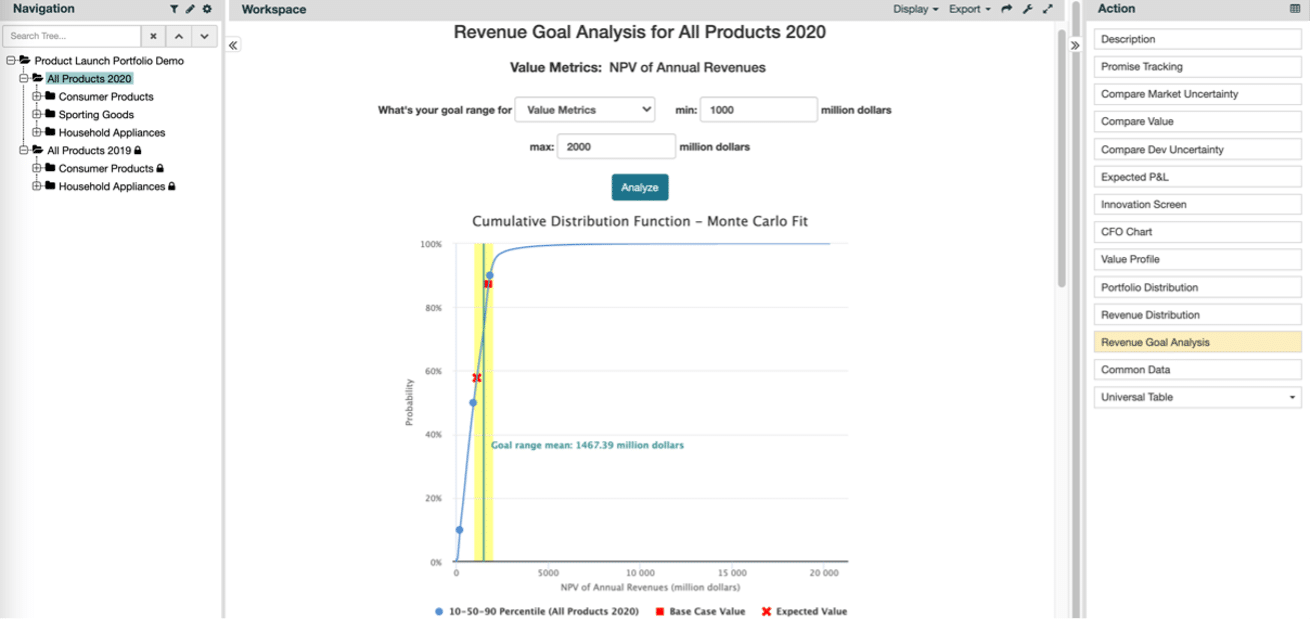
Depending on the goalpost, Portfolio Navigator will show you the key projects based on how big the contribution is to the goal.
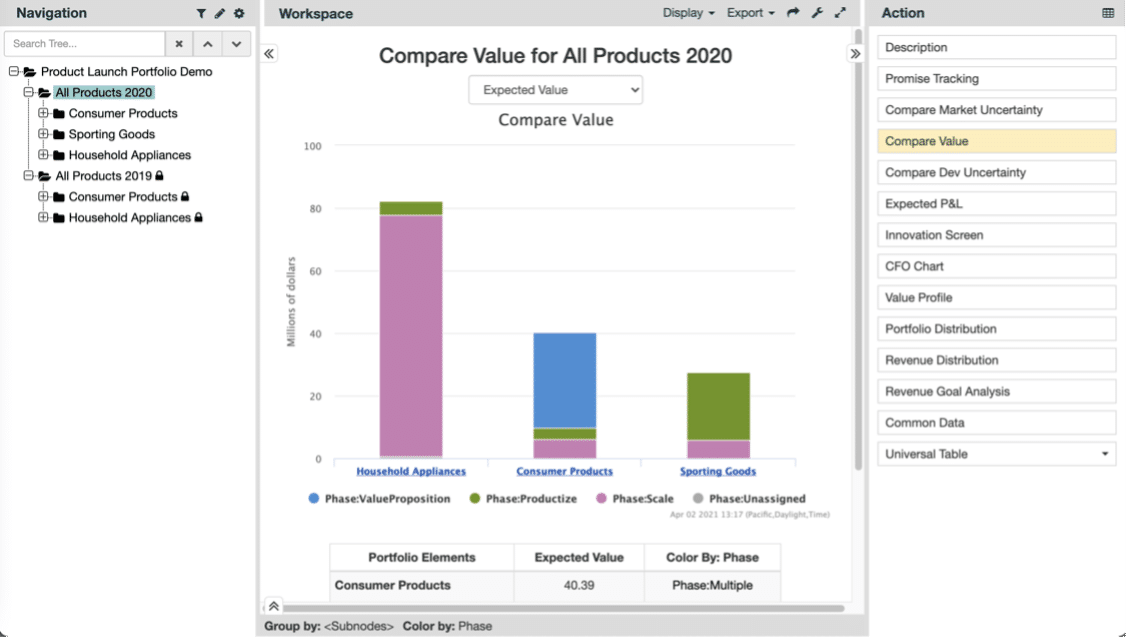
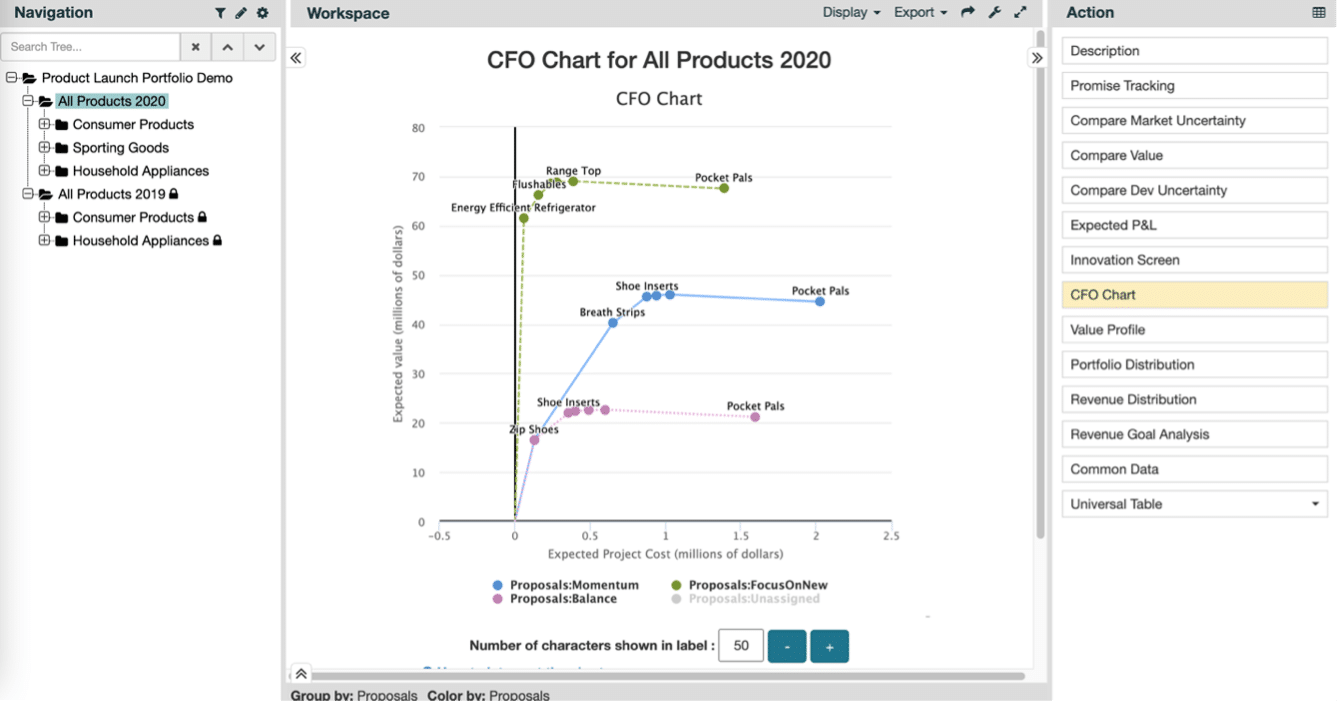
CFO Chart on different strategies
You can now compare multiple investment strategies in the same CFO chart while some projects may be shared among several strategies.
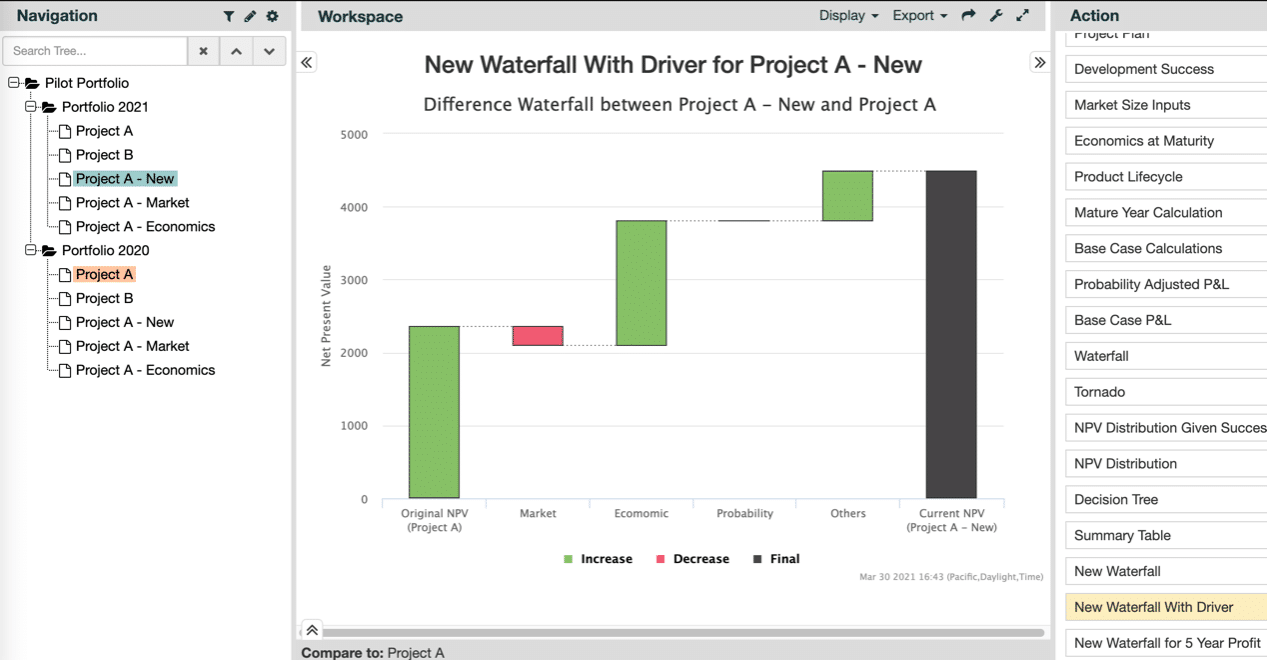
Difference Waterfall
- Does the project value increase?
- Do we have more positive signals in the market?
- Are we able to lower the development risks?
- And what effect do they have on the overall value?
Difference Waterfall allows you to compare any two projects or any two versions of a project and see the drivers contributing to the value change.
Other charting capabilities
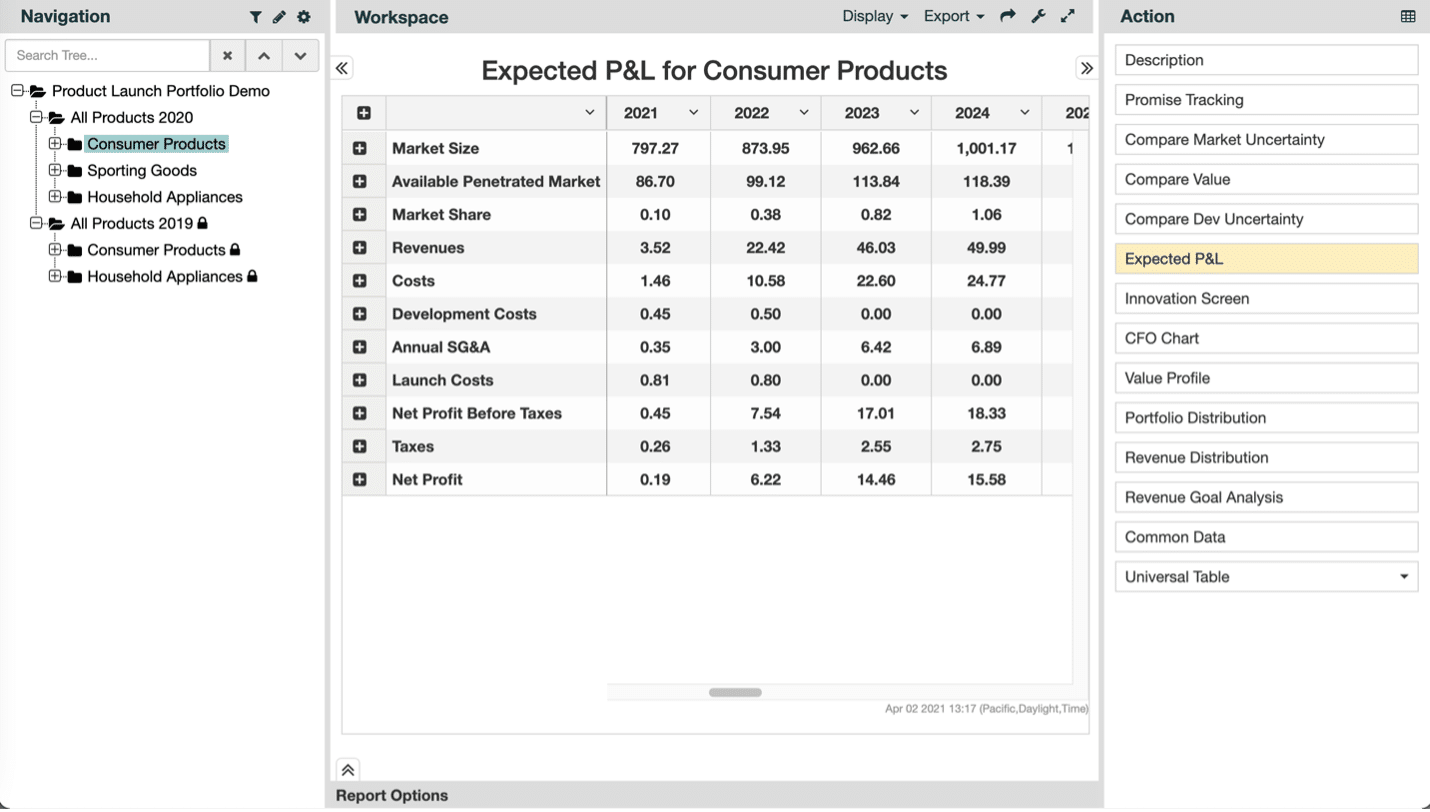
Charting on roll-up P&Ls
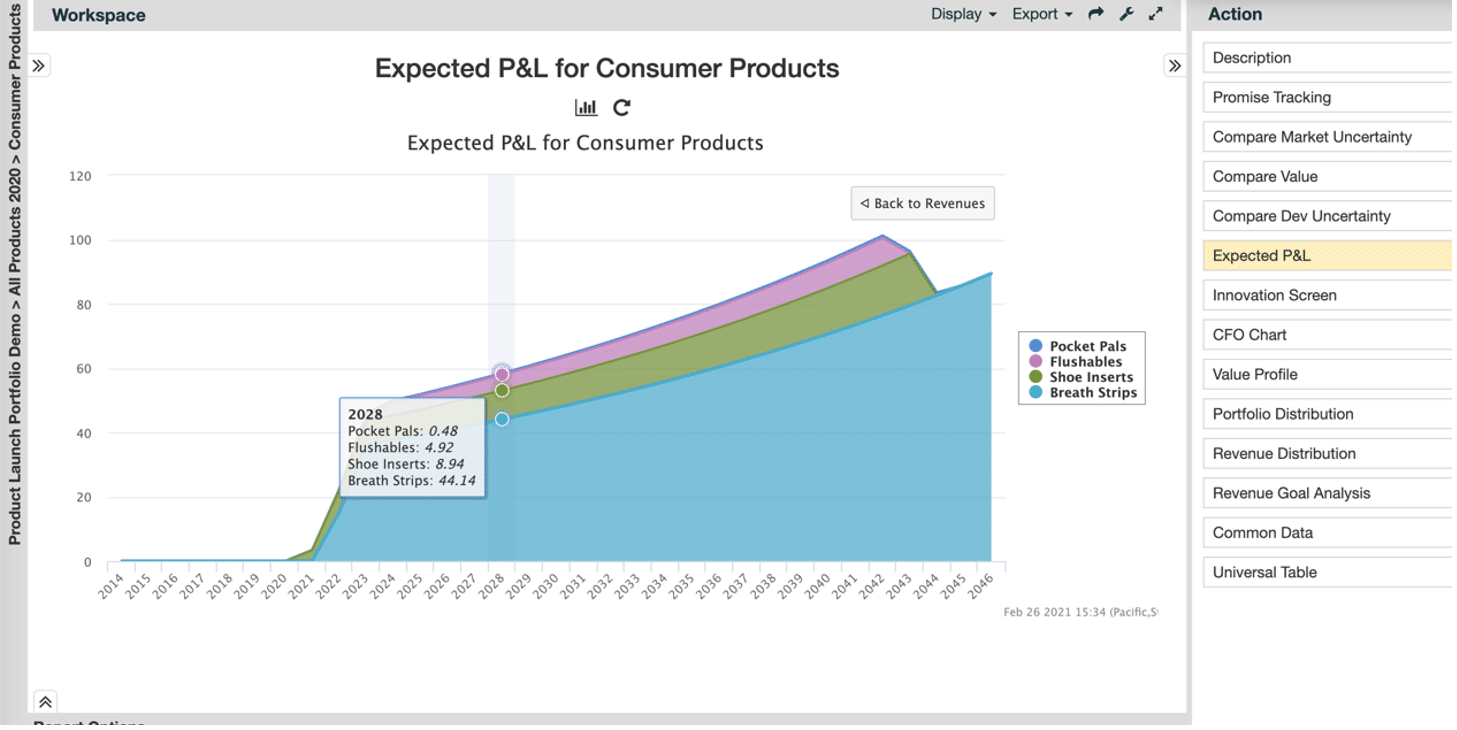
It is difficult to see how each project will perform in a roll-up P&L full of numbers. Portfolio Navigator enables you to turn P&L revenues into a line chart with a few clicks.
Before
After
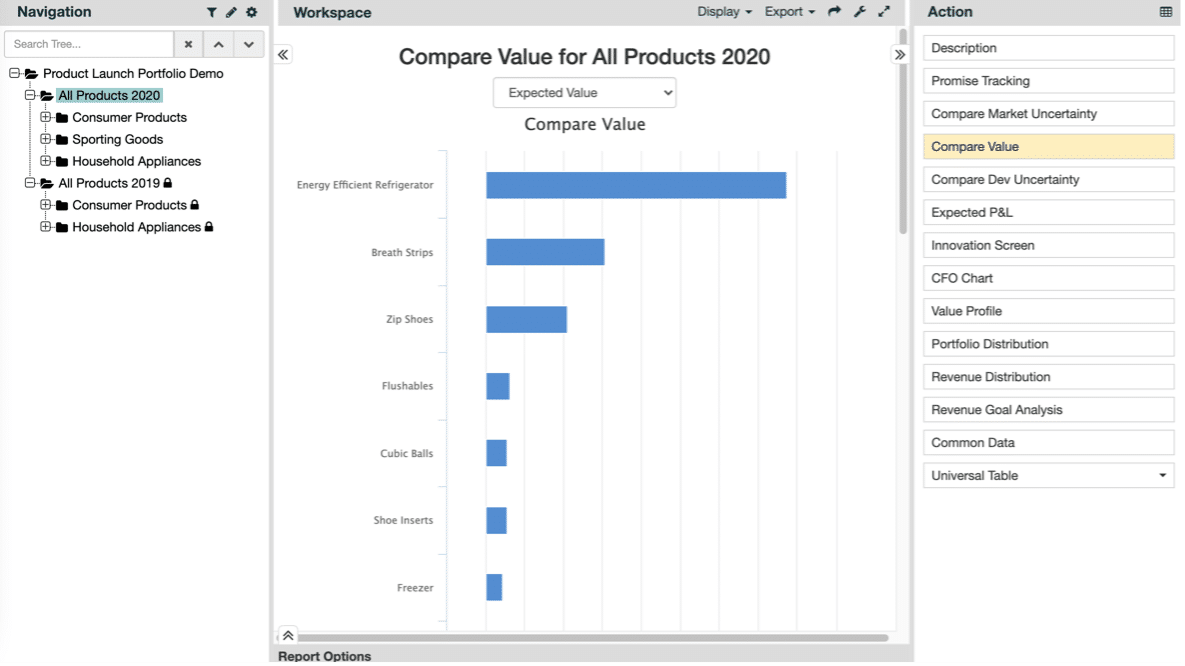
Category Chart
Do you have a balanced portfolio across multiple dimensions e.g., market, technologies, maturities?
With a few slice and dice selections, you can quickly see your portfolio composition.
Before
After