Learn how this graphical method helps clarify ideas
Conflict, confusion, and analysis paralysis can be overwhelming when making decisions about innovation. Sometimes, we can even get into shouting matches over what’s important. Such issues can obscure opportunity from view, preventing any resolution and progress.
Consider the time and energy expended when your team hits a snag and conflict erupts. To address this, it is critical to keep the potential upside of each course of action in mind and to proactively manage risk so that your team can move forward with confidence and clarity. This is where the tornado diagram, a frequently overlooked conflict resolution tool, comes in. When correctly constructed, the tornado diagram is a useful tool for product teams looking to reduce complexity and pivot effectively.

While actual tornados can wreak havoc and destruction, the tornado diagram might just become your new best friend. This diagram—commonly used by decision professionals—is a practical and invaluable approach to conflict resolution. Teams can make logical decisions with confidence that their choices will lead to success and growth.
The Power of the tornado diagram is in its simplicity
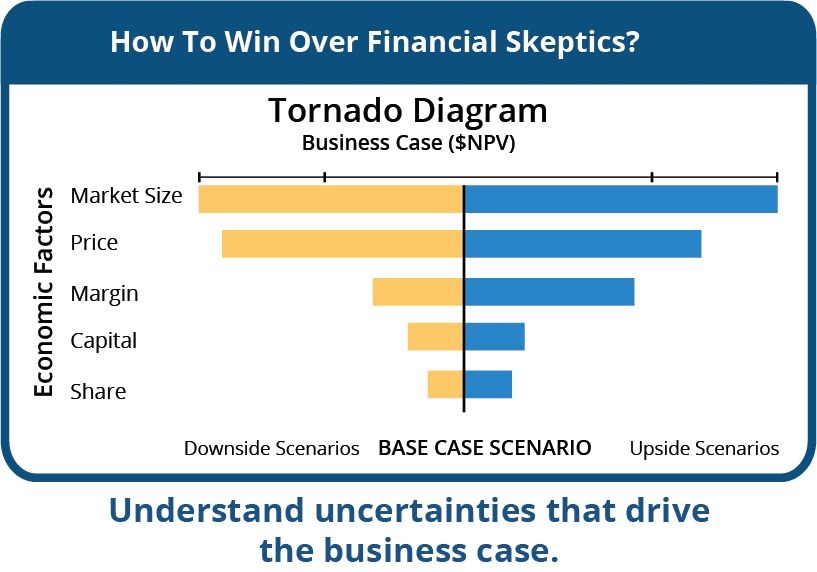
The big idea is to show the business case value of many different sets of assumptions comparatively on a single graphic (see below). Relative to a reference case, bars to the right show upside and bars to the left show downside. The biggest bars show you which assumptions matter most in the business case and in innovation help you focus on how to drive the upside. Rather than simply arguing about which assumptions are “correct” or making a dull “conservative” business case, show the impact of all the assumptions and use that to focus energy on what really matters.

Figure 1
So how do you drive growth in a changing and uncertain environment?
A tornado diagram allows you to visually compare and rank business case. Teams can quickly identify which elements are most important and should be prioritized, making it easier to gain alignment on how to best handle any conflict or confusion.
Reading a tornado diagram is deceptively simple: big bars need more attention; small bars don’t. However, building it out correctly might look challenging, but doesn’t really have to be. You need to construct a series of conversations about assumptions, quantify the ranges, and put them through a financial model.
The process for building this diagram begins with gathering data on the different variables that you want to compare. In building the forecast, there is nothing gained in arguing about what the “right” number is. That will exacerbate a conflict. Instead, use the tornado diagram by working with ranges instead.
How to use tornado diagram strategies today
Not sure how to build a tornado diagram? That’s fine. Here’s an exercise you can start immediately for a project, no tornado necessary. It is easiest to focus on a few critical conversations around the business case, often defined around financial factors that are assumed in the business case, like market size or production costs.
Take your potential business case and invite your resident optimist to think of the best case possible. For each financial factor, ask, “What critical issues need to be true to realize this optimistic case?” Write them down, keep optimistic. Then invite the pessimist to role-play being an optimist. Finally, considering these factors, quantify the scenario with an optimistic number. Now, let your local pessimist do the same thing for the worst case scenario, and quantify that set of assumptions. Then put this range into your business case and look at the impact of this range of assumptions on the figure of merit in the business case (often NPV).
Use the analysis to identify which sets of assumptions matter most—what items have the biggest bars? Then ask “What evidence do we need to prove either the best case or worst case right?” and “How can we influence the upside outcome?”
Examples of conversation prompts
Let’s say your financial partner concludes his remarks on your innovation project in this way: “and with these conservative assumptions, the project isn’t worth very much.” When you begin your response, “But the potential is so much larger…” you can already see that you have lost the audience—you aren’t speaking in the language of business: financials.
You realize that your innovation is not about delivering on a conservative assumption; it is about changing things to create something new. So what has to change? Reframe your response: “What my colleague says is true, but that is not what I am proposing. Notice that if we can figure out a way to increase market acceptance then the value is much higher and would be a great outcome financially.” Everyone is nodding happily at the idea of large financial returns. “What I am actually proposing is a project to see if we can influence market acceptance, perhaps by finding a partner or getting an endorsement. Can you fund my work to determine if that is possible?”
You have just converted a difficult decision (fund an innovation with a mediocre business case) into an easy one: fund the innovation to figure out if a great business case is possible.
What if you could do this systematically, on every innovation project? Or even on any project where there is conflict over assumptions or other uncertainty?

You and your team will soon be saying “good-bye” to a lot of the frustration and time wasted that comes with confusion and conflict and “hello” to keeping your team aligned in moving the ball on projects that will keep you focused on a relevant and high-growth future.
Need help putting a tornado diagram together? We’ve helped many companies using this method and can offer you consulting or software tools to automate the process. Reach out to David Matheson by email or on LinkedIn.
Additional tornado diagram resources
- Here’s a short video (<5 mins) on the mechanics of Tornado Diagrams.
- Simple Tornado Excel Macro


