Achieving Breakthrough Growth

Your innovation portfolio is the engine that drives your future growth. How do you rev up that engine’s power?
In our webinar in June, Shawn Williams of Rogers Corporation shared his experience in applying rigorous portfolio management techniques to increase his portfolio’s power to make Rogers grow. As Vice President of Research and Development, Shawn is responsible for guiding innovations from the laboratory to their use in Rogers’ products.
Rogers has been in business for 185 years and has transformed itself many times throughout its history, so it had a demonstrated ability to adapt and innovate. Still, when Shawn joined the company, he believed that it could improve the returns on its investment in innovation and drive breakthrough growth in the company’s revenues. Where Rogers expected $11 million in future revenues from each of its existing innovation projects, Shawn set a goal to increase that to $50 million per project.

Organizing Innovation Opportunities

He organized the innovation opportunities around a generational view. Generation 1 are incremental improvements to existing products and technologies, usually with a lifecycle of less than two years. Generation 2 are evolutionary innovations that introduce new technologies into existing product types and markets, with a two- to three-year horizon. Generation 3, revolutionary innovations, represent a leap ahead in technology and have a three- to five-year horizon.
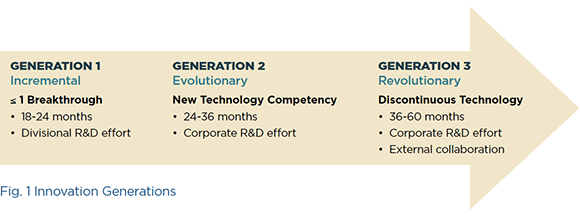
Figure 1, Innovation Generations
Rogers uses a Real-Worth-Win screening system to evaluate innovations:
  • Is this opportunity real? Can we make the technology work, and do customers want it?
  • Is the opportunity worth it? Is the market big enough and the expected uptake high enough to give Rogers an acceptable return?
  • Can we win? Do we have the technological capabilities, the market knowledge and the competitive edge to make this opportunity a success?

Evaluating

What Shawn realized, however, was that this screening wasn’t enough to improve his portfolio’s power. Simply passing the R-W-W test wasn’t enough to drive the value of the average project to the goal.
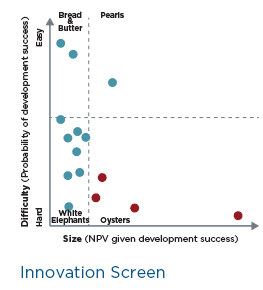
Shawn engaged SmartOrg to develop more rigorous methods of managing the projects as a portfolio. One of the tools SmartOrg provided was the Innovation Screen, a map of the projects in the portfolio by probability of success (the vertical access) and the value of the project if it succeeds (the horizontal axis).
Small but easy projects are a company’s Bread and Butter, a consistent if unexciting source of growth. Small but difficult projects are White Elephants that take more care and feeding than they’re worth. Large and easy projects are Pearls of great value for the high growth they produce. Large but difficult projects are Oysters that, with the right attention, can grow Pearls.
Innovation Screen chart
Shawn’s insight from the Innovation Screen was that White Elephants drag a portfolio’s power down. It makes sense, where possible, to transform them into Oysters, and where that’s not possible, look at cancelling them to redirect resources to helping Oysters succeed.
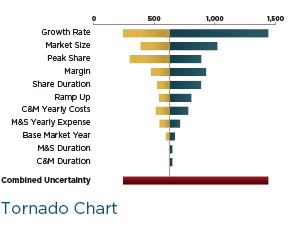
Tornado Chart image, combined uncertainty

To find out how to make White Elephants (and indeed all projects) more valuable, Shawn turned to another tool from SmartOrg, the Tornado Chart. This let him look at each project’s success factors and the uncertainty built into each (shown as the length of each bar). When the bars are sorted longest to shortest, different projects will have different factors on top. The key insight is that the bars that extend furthest to the right represent the factors that can drive the project’s value to the upside.

Shawn was then able to compare the projects in his innovation portfolio by their upside potential, as shown in the Project Comparison Chart. He realized that some low-value projects had little upside potential, and so weren’t ever going to be able to drive breakthrough growth. This let him choose projects to phase out. At the same time, he could see other projects with strong upside potential, and by looking back to their Tornado Charts, he could create Upside Exploitation Plans for each based on their critical success factors.

A big payoff

His application of these rigorous portfolio management methods had a big payoff. Average project value increased from $11 million to $40 million. With a 40% increase in Rogers’ innovation budget, Shawn was able to increase the number of projects in his portfolio by 25% and still increase his expected new revenues by an impressive 160%. The portfolio management methods are now a permanent feature of Rogers’ planning process.
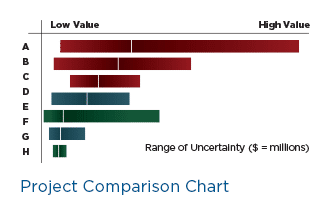
Project Comparison Chart, Range of Uncertainty