What is Portfolio Power?
A company’s portfolio of innovation and new product development projects is its engine for growth. New products and product and technology innovations replace products that are at end of life, and they provide the company a way into expanded and new markets.
You expect your innovation portfolio to generate sizable future revenue growth. But will you achieve that growth target? Can you get more revenue with the same investment?
From sixteen years of analyzing innovation and new product development portfolios, SmartOrg knows that half of the growth your portfolio generates depends on how much you spend, and half on how you spend it. You already know how much you spend on innovation and new product development. SmartOrg can show you a way to measure whether you’re spending it on the right mix of projects.
We call this measurement Portfolio Power. It depends on two things: how many of the projects in your portfolio have large expected returns, and how many have a high chance of success. Amazingly, just these two factors can predict how much growth your portfolio is likely to generate, and how likely it is your portfolio will meet your growth goals.
Even better, the Portfolio Power assessment can give you guidance on where and how to adjust your portfolio to generate more revenue growth. You can use the analysis to drive effective conversations with project owners and corporate executives about which projects have the most growth potential and which ones don’t make sense.
How It Works
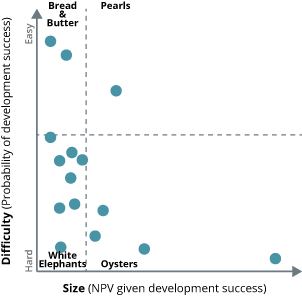
Innovation projects fall into four categories:
- Small and Hard (“White Elephants”)
- Small and Easy (“Bread and Butter”)
- Big and Hard (“Oysters”)
- Big and Easy (“Pearls”)
It’s apparent that each of these types of project will contribute different average levels of growth to the overall portfolio. The big and easy projects generate large returns with low risk of failure. At the other extreme, small and hard projects are prone to failure and will only yield small returns if they do succeed.SmartOrg calculated historical average returns for each type. Smartorg uses a given portfolio’s project mix to create a weighted average return factor, which we call Portfolio Power.
Portfolio Power is a measure of “where you spend it,” how well the portfolio’s resources are allocated to generate growth. Portfolio Power gives an estimate of the likely growth a portfolio will generate and of the chance of meeting the portfolio’s growth goal.

A typical portfolio’s projects, distributed on the easy/hard and small/big axes


