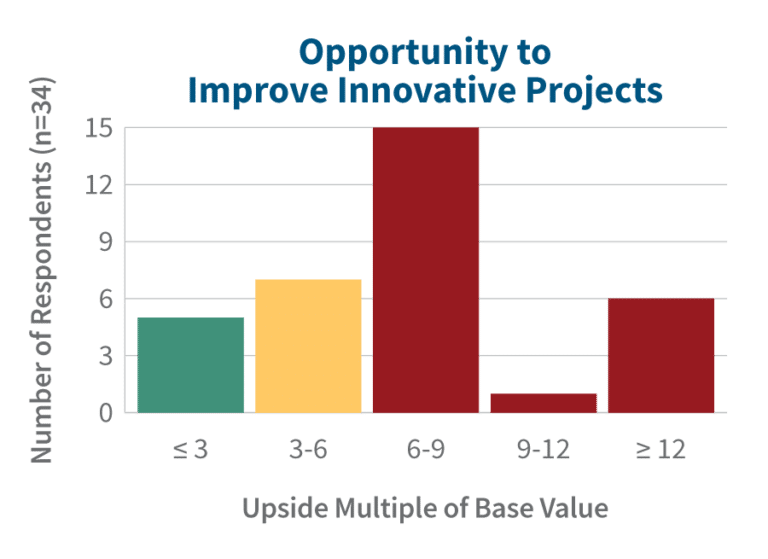
At a recent workshop, a group of 35 R&D and innovation executives in industries ranging from automotive to healthcare came together to benchmark improvement potential. Each selected a real example project from their portfolio and applied an estimation model based on benchmarks and experience developed at DuPont Safety & Construction with SmartOrg. The average improvement opportunity across this diverse group was 8.1 times the current return on innovation!

Fifteen percent of the group found improvement opportunities for their selected project to be three times or less. However, a full 65% of the participants found improvements in their sample projects greater than six times, and 18% found improvements great than 12 times!
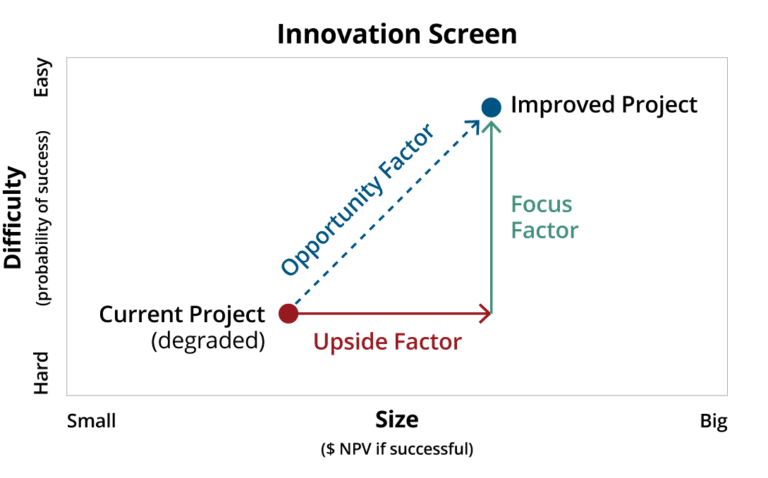
The way the participants reimagined their example projects was based on the two big factors that drove DuPont S&C’s results: finding hidden upside and healing wounded projects.
Opportunity to improve innovative projects graph

Finding Hidden Upside

The unintended consequence of rewarding “reliable delivery” or “meeting the promise” is mediocrity. Business cases show the bare minimum achievable instead of the maximum possible. Few project teams put any energy or attention into the factors that drive the upside, leaving these critical drivers of success completely up to chance! Teams focus on small safe gains and achieve them, and therefore never deliver on a big return. To test this, participants in the workshops considered factors that could drive the upside in their sample projects. Their reasons were varied: over-delivering on cost or performance, expanding channels, finding mainstream (vs. niche) opportunities, etc. Then we asked the participants to be optimistic and estimate the upside if a few of these factors worked out in their favor. Collectively, 70% of the participants had upsides greater than 2 times the project base value. The average upside across our group of diverse companies was 3.5 times, fully 20% of the participants had upsides above 4 times and about 10% above 8 times. A few massive upsides across a portfolio make a huge difference. Even if only a few projects make modest improvements towards the upside, the combined effect across the portfolio is large.

Wounded Projects

Companies often inadvertently wound their innovation projects, giving them too few resources to have a reasonable chance of success. On the surface, it seems like the right thing to do. Many project leaders pad project budgets a little, so putting a little resource pressure focuses their minds and drives project leaders to focus and make good use of their efforts. However, resource management systems tend to allocate scarce resources across all projects, ensuring each important project gets some. After a bad quarter, project leaders are asked to give some budget back so the company can meet overall spending targets. Innovative projects get systematically penalized compared to traditional projects that require less imagination to understand. Accumulated over the years, it becomes death by a thousand cuts. Project leaders learn to ask for what they think they can get, not what they need. The portfolio is cluttered with many projects demanding attention: each project gets some, so none gets enough. We asked our executive participants, “Do your sample projects have the level of labor (FTEs) and funding needed?” Only 13% of participants had sample projects that had 75% or more of the required resources. In this range, resource pressure can drive efficiency. However, 30% were in the danger zone of resources in the 50-75% level. This isn’t efficiency; it is neglect. Fully 56% of the sample projects had less than half of the resources needed for success! This is starvation. Better to kill these projects outright than to have them drain resources from the portfolio and hope from the staff.

Focus = Resources + Attention

Focus to drive innovation is more than just resources, it is also attention. Innovative projects challenge the status quo: they need special creative thinking and energy. The people with the level of power, creativity and judgement to contribute this special attention are rare in an organization. With cluttered portfolios, rare and powerful people end up reviewing all projects roughly equally. To be sure, there are “strategic” and “priority” projects, but are these really the ones with upside? Participants in our group considered the level of challenge in their sample innovative projects. Then each participant assessed the level of attention their project actually get (100% meaning it was getting attention appropriate to intrinsic challenge, 50% meaning half that attention, and so on). Only 17% of the sample projects even get close to the attention needed, at 75% or more of the requirement. A terrifying 26% of participants rated their projects as getting less than 25%. Our executive participants combined the resource and attention estimates for their projects into a focus factor. On average, their sample projects only get 23% of the focus they need to have a reasonable chance of delivering a timely result.

The Path to Improvement

To fix the problems of upside and focus, you must address the underlying death by a thousand cuts that projects face. First, rigorously assess the value of your portfolio. Really consider the upside as well as the base case of each project.
Innovation Screen graph

Then declutter. Get rid of the small projects that, however good, won’t move the needle on growth. Focus the attention of the rare and the powerful on projects with breakthrough upside and significant innovation challenges. Determine what level of resources projects actually need (not what they are asking for), based on the innovation challenges they actually face.

By putting energy into the upside of opportunities, the value if the project is successful increases. By focusing resources and attention, the probability of projects’ success increases. This is a powerful path to breakthrough growth.
When you are ready to try out the assessment for yourself on an example project of your own, go to the Innovation Opportunity Factor Calculator at smartorgdev.wpengine.com/opportunity-factor-calculator.