We recently helped a major chemical company conduct its portfolio review for 128 growth projects. Using SmartOrg’s Portfolio Navigator web-based evaluation platform, they systematically looked at the uncertainties in their business cases. Many project leaders saw tremendous upside and developed ways to pursue it. But when I systematically looked across the projects, I found a simple pattern in the upside factors with implications far beyond this particular company. The portfolio of 128 projects was broad, ranging from incremental investments and line extensions to forays into adjacent spaces and breakout projects.

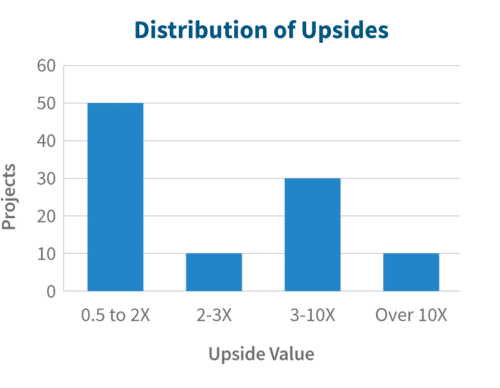
It contained both Bread & Butter type projects (easy but small returns) and Oysters (difficult but big returns). It crossed five different business units, each around $1B in revenue, ranging from industrial materials to consumer products. You would think each business unit or type of project would have its own special factors that drove the upside, but there is a surprisingly simple pattern. The upside potential in the projects is significant. The smallest upsides are 0.5X (50%) or so above the base cases, and about half the projects have upsides in the range of 0.5X to 2X of the base. The largest upsides, comprising about 10% of the projects, are larger than 10x the base cases and 40% of the projects have upsides 3x or larger, still very significant.
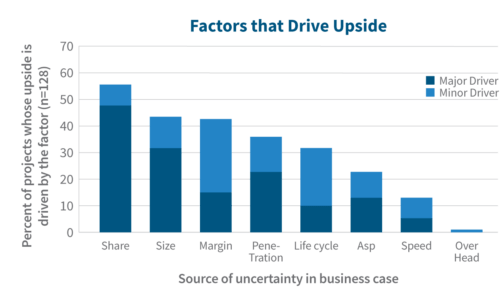
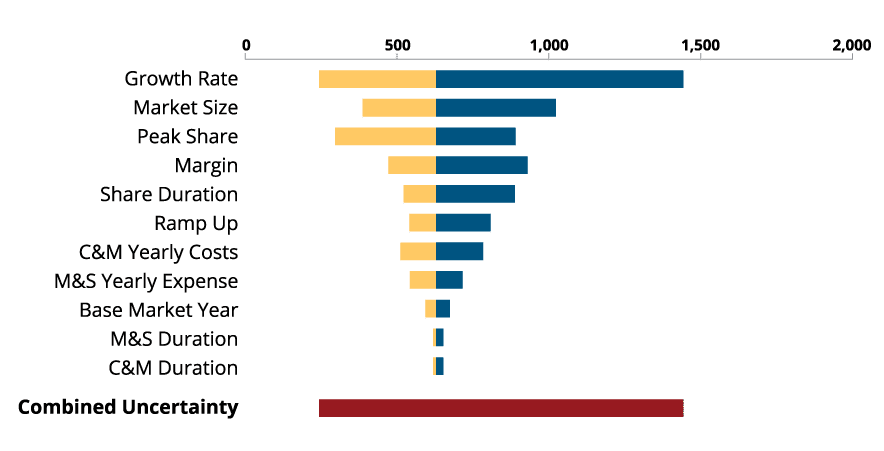
Each of many sources of uncertainty were considered for each project. Teams created scenarios for upside (and downside) for each source of uncertainty. Then these were quantified as ranges (high, median and low) for each factor in a business case. Portfolio Navigator determined which of these factors had the biggest impact on the overall Net Present Value of the project and presented these results as tornado diagrams. Reviewing all the projects, we classified each factor based on how much it drove the upside – one or two might have a “major” impact in driving the upside, a few might have “’minor” impact in driving the upside. Then we totaled up the number of times each factor impacted the upside, expressed as a percent of the 128 projects in the graph titled “Factors that Drive Upside”.

The Share Factor
For example, the Share factor has the biggest impact on upside. It is a major factor in almost half the projects, and a driver (major or minor) in about 65% of them. For this chemical company, share represents competitiveness: in other words, how much new product features or attributes tip the scales and create purchasing behavior. Their engineers are excellent at understanding customer needs and proposing new features and performance attributes to make customers better off. But they are systematically less clear on whether these improvements will significantly shift purchase behavior. To drive upside, don’t take your customer’s word for what is desirable, focus on what can change their behavior.

The Size Factor
The next largest factor is Size, a major factor on about a third of the projects. This represents how many people (customers) care about the offering. The chemical company is customer-focused, frequently engaging them and getting suggestions. Many projects are direct responses to customer requests and requirements. This admirable culture hides a hidden assumption, that a customer is representative of a market. Thus the market questions aren’t well explored, and consequently size becomes a major uncertainty. To drive upside, build for a market, not a customer.
Do you see the simple pattern yet? If you see these as issues around understanding the market, you’d be right. But there is more.
The Margin Factor
The next factor is Margin, a major driver in 15% of the projects, but interestingly a very common minor driver, bringing its total driver level to 42%, a tie with size. For this company, the margin factor represents the ability to extract value through the value chain. In other words, can they Value Price or must they use Cost Plus type of pricing through their value chain?
For example, they might make a performance fiber, which is spun into thread, which is woven into cloth, which is made into a garment. The value of the performance fiber is realized by the user of the garment, not the direct customer of the chemical company. But at each stage in the value chain, there is a player who wants to claim a big share of this new value. In the competition for economic power along the value chain, does our chemical company get pushed down to a modest cost plus claim (low margin)? Or can they establish their value enough to get a big share of the value ultimately created (high margin)?
Thus margin represents critical thinking about the business issues and strategy through the supply chain. The chemical company’s strong engineers were accustomed to creating product attributes so powerful that they could historically extract lots of value. But times were changing and this was less often true. The engineers focused on making great products and tended to justify their efforts based on a simple cost-plus business case. But this left their ability to extract the value they created up to chance. To drive upside, it is not enough to make a great product: you have to maneuver so you can claim its value.
The Penetration Factor
Penetration is another factor fundamentally about critical thinking about business issues, and it is a driver for about a third of the projects overall. It is typically more important the more innovative a project is. Penetration represents the ability to change institutions or patterns of behavior.
A simple historical example of this is the conversion from digital phones, dominated by Motorola and Nokia, to smart phones, dominated by Apple, Samsung and Android. The market slowly shifts from one way of conceiving of the category to another. Smart phones come out. Then apps develop and take root. Over time, the smart phones penetrate the digital phone market (and even expand it).
In the case of the chemical company, they would innovate into a potentially expanding area, like fire safety barriers for transport of high energy batteries, a very small market. But if the industry standardizes on its methods, it could open up vast opportunities. The project teams usually made arguments along these lines, saying that in spite of a small business case, they should invest because it was a “strategic growth area”.
The critical issue was that they weren’t doing anything about it. These engineers were just working to make the product, qualify it, and demonstrate how well it performed. The essential issue, penetration, was completely left up to chance. Innovating around penetration required a different skillset and lines of thinking, for example, partnering with competitors to establish a standard, or working with regulatory bodies, or shifting position in the value chain. To drive upside, innovate around the leverage points that will convert a market to your way of doing things.
At this point, if you are thinking that the pattern is to focus on Market and Business issues, you wouldn’t be wrong. For a technical and manufacturing-oriented company like the chemical company this data is from, that conclusion is pretty typical. But that’s not actually the general pattern.
The Comfort Zone Principle
The general pattern is the COMFORT ZONE PRINCIPLE. Whatever is in the comfort zone of the dominant people in the organization, whatever is the thing that the organization takes the most pride or has the deepest history in, that is the comfort zone. For our chemical company, its customer-focused engineering. It is a great strength and should be celebrated.
But it leads to a great weakness. Issues in the comfort zone get overworked, because people are attending to these issues and are really good at addressing them. Things outside the comfort zone get neglected: sometimes through simple lack of ability, but often, actively neglected, usually with culturally sanctioned bits of wisdom.
Have you heard phrases like “if we take care of the customer, he will take care of us”? Every company has their version of these types aphorisms on many different topics. The often unintended consequence of such wisdom is that they become justification for not looking beyond the comfort zone, in this example, satisfying the customer is enough so we don’t need to pay much attention beyond that. But if PENETRATION, MARGIN, SIZE or SHARE are the factors that drive upside, then merely satisfying the customer is damning the organization to mediocre growth and leaving the upside to chance.
The chemical company in this case has taken steps to take the full perspective on innovation, adding capabilities in marketing and critical thinking about the business issues. They are working to fill their blind spots on innovation.
The comfort zone principle is a powerful predictor of where to look for drivers of upside in an organization. However, simply exhorting people to get out of their comfort zones, or pointing out that they need more marketing or business thinking, is rarely effective.
How to Drive Effective Action
To drive effective action, I’ve discovered that project leaders and teams have to realize it for themselves. A good strategic portfolio process can help people down this path with tools like the tornado diagram. When teams see in their own terms and with their own data what actually drives the upside of theirprojects, they get interested. When executives encourage teams to explore the upside and ask what it might take, teams get inspired.
And that is fundamentally the biggest driver of upside:

Teams that understand concretely where they have to go to make a project awesome, even when it is outside their comfort zone.


