A Silicon Valley company recently asked SmartOrg to help with their growth challenge. They knew that to really grow, they needed to identify technology inflection points that defined the next big waves that they could ride. But as their company grew and their industry got more complex, it became harder to spot these inflection points. Meanwhile, they faced relentless pressure to invest in easily justified incremental changes in current product lines, which reduced investment in inflection-point exploration.
In their small conference room, the portfolio manager proudly showed me how they analyzed these tradeoffs. The presentation was impressive, with qualitative classifications for business areas such as Emerging, Growing, Mature and Declining, and financial information, such as seven-year NPV, development investments, and risk factors. Each project had decks of supporting information, covering the value proposition, competitive analysis, and many other areas. It seemed like I didn’t have much to add.
Then he made a request: “We want to show strategic value.”
Why?
“Because all this information doesn’t help us make decisions. We know that some projects that look bad on these metrics are ones with strategic value for us. I’d like to have another column called ‘strategic value’ so it is visible.”
My jaw dropped. Their portfolio process and displays looked good, but they weren’t actually designed to help them align on where and how much to invest. “Yes,” I sad, “SmartOrg can help.”
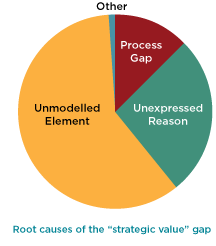
We started by defining “strategic value.” After brainstorming a list of 94 factors in 13 categories that they felt were important to their strategic decisions, but somehow not reflected in their portfolio displays, we realized that a lot was missing. A simple “strategic value score” wouldn’t help them drive growth: we had to look deeper.
We analyzed the 94 factors and grouped them into three root-cause areas or types of gap:
- Unmodeled Elements
- Unexpressed Reasons
- Process Gaps
Let’s look at these categories.

Unmodeled Elements
Their financial model had a seven-year time horizon, based on how long it takes their business to deliver new products. Yet this timeline is too short to reflect the impact of an industry inflection point, which typically extends into the next generation of products.
Several major factors on the list dealt with “financial value beyond current time frame”. While their seven-year model had a “residual” value to account for this, it didn’t help because there was no real modelling or discussion behind it.
They needed to model what matters to the decisions. Their standard financial model had been designed for incremental projects. But their decisions on inflection points were not incremental: they were long-term innovations. This meant they needed to incorporate uncertainty into their analysis and model these projects as innovation. That required them to develop evidence and show clearly the scenarios for the long term.
Unexpressed Reasons
Many factors weren’t measurements of value; they were supporting evidence or reasons to believe. For example, if executives believe a project “meets customers needs,” they’re more likely to believe it will generate returns. Projects that haven’t demonstrated meeting a customer need are much more speculative, and the executives are less confident.
The project portfolio evaluation spreadsheet was a wall of numbers, so it was hard to understand. They needed to connect reasons to the numbers in their portfolio system to enable a strategic discussion.
For example, tying reasons to market share scenarios adds tremendous clarity. High: 100% share, we are the only provider of the technology. Median: 75% Competitor X has a competitive offering, but we are dominant. Low: 25% Competitor X becomes dominant in the technology.
Process Gaps
We realized their traditional portfolio process (first justify each project, then roll it up to a portfolio view) wasn’t designed to drive decision making or inform real choices. This process created a strategic value gap because it didn’t ask for and obtain the right information to consider a range of alternatives to existing project choices. A better process would give other approaches to more effectively inform decisions and resolve conflict.
For example, they wanted to determine whether each project was “needed to meet revenue goals”. This creates unproductive arguments about whether my project or your project is needed to meet revenue goals. To make this a productive discussion, you have to reframe at the process level.
Whether a project is needed to meet revenue goals is not an attribute of the project. It is created by an executive’s portfolio choice. When a decision maker looks at all the projects and says “I will fund A, B and C” he or she is declaring that the organization is relying on those three projects to meet their goals. The decision maker could have also picked “D, E and F”, in which case the needed projects would be different.
It is essential to design the portfolio process to support decisions on where and how much to invest. Don’t just “gather data” and “roll it up”.


