Suzanne stared at her computer screen as she prepared her presentation for the decision board. She nervously tapped her fingers, wondering how she could possibly convince these tough birds that her product idea had great promise, despite a lot of uncertainty around pricing, market acceptance, market share and a multitude of factors that would affect financial success.
She had a good reason to be nervous. This was her second attempt to convince the board. First time, she was armed with a detailed Excel spreadsheet chock full of numbers, macros and formulas, accompanied by a 20-slide PowerPoint deck filled with information-laden bullet points.
It was not a happy time. First, the financial lead challenged her assumptions about cost and margins. “What was her evidence, aside from ‘good judgment’ and ‘a feel for the market based on questionable historic data?’”
Then, it was marketing’s turn, “We think you have grossly over-estimated the size of the market and our ability to achieve sufficient share to make your product a viable one within the marketplace.”
Frustrated, Suzanne tried vainly to defend her numbers but the more she tried, the more questions kept coming. The decision board leader, a gruff no-nonsense senior vice president finally came to her rescue, “Suzanne, I suggest you rework your spreadsheet and assumptions and try again, but you only have one more chance.”

Suzanne’s dilemma is not uncommon. We have all been there. Her challenge was to find a way to engage the decision makers in a dialogue rather than in making a go/no-go decision based on defending a single business case. The key word is “dialogue”–a conversation among colleagues, peers and experts around the most important factors that contribute to a successful business proposition.

The first step in convincing the board would be to determine which factors have the most impact on net present value (NPV) and what is known and unknown about them (the range of uncertainty). To accomplish this, Suzanne asked a decision analyst to develop an analysis of her business model using ranges as inputs rather than trying to defend single-point numbers. Ranges were agreed upon by experts and peers in related functions (marketing, sales, finance), reflecting the best possible information available. The results looked like the table on the right.
Chart showing market share, tech pentration, share duration, price/unit, total available market, annual investment, COGs/unit, one-time launch data
Tornado diagram showing data
The computer then ran a program that calculated the effect of each factor’s Low/High/Mid assessed values on NPV, arranging each based on the relative impact on NPV. The resultant chart, a “tornado diagram,” clearly portrayed the relative importance of each factor.
The tornado helped Suzanne demonstrate that she and her staff had done a thorough job of investigating the uncertainties around economics key to launching a new product, the analysis revealing that two factors dominated achievement of value (NPV): market share and technology penetration. Market share could vary between 15% and 30%, having an impact on NPV between $40 million and $125 million. And technology penetration could have an impact on NPV between $50 million and $110 million. These are the two factors on which the board needs to focus; the dialog proceeding along the lines, “what if it turns out that we have to live with the low range–is it a go or no-go?” Or, “what do you think you can do to provide the best chances for achieving the high value?”

The dialogue, stimulated by the analysis and fostered through spirited interchange served a number of purposes, including developing a clearer picture of the downside exposure and upside potential of the proposed product while building buy-in and understanding on the part of management and stakeholders.

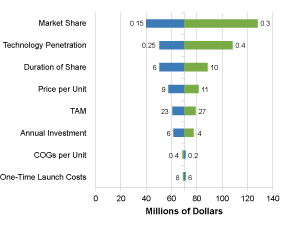
Suzanne learned an important lesson: When you need to convince others, clearly acknowledge what you do and do not know, capturing the knowledge gap through ranges of uncertainty. Devices like the tornado chart contain a great deal of information, engendering conversation and dialogue among management, stakeholders and team players, and leading to quicker, better decisions while fostering cross-functional buy-in.

The tornado chart is the basic tool for addressing the uncertainties that surround future decisions of all kinds. Learn more about the use of tornados.