Thinking Big – Lesson from SmartOrg’s Community of Practice
By David Matheson  4 min read
At this year’s SmartOrg Community of Practice (see note), the participants explored one of the most important questions in innovation and product development: what stops us from thinking big? Too many companies manage opportunities with home-run potential as safe base hits; they miss out on the breakthrough growth that is in their grasp.
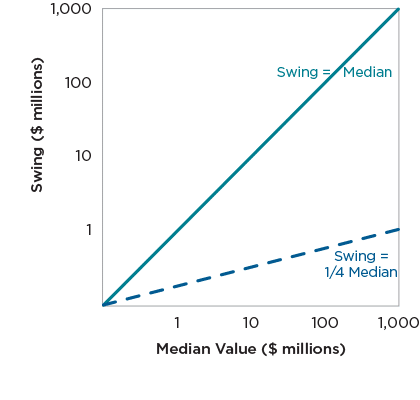
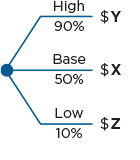
The Swing Chart illustrates this problem. The X axis is the median value of the opportunity (the 50th percentile value, where the probability of exceeding it equals the probability of falling short). The Y axis is the swing (the 90th percentile value minus the 10th percent value). The swing represents the realistic range of project value.
The chart shows two swing-to-median ratio lines. On the 45 degree line, Swing = Median. On the lower dashed line, Swing = 25% of the Median.
On and below the 25% line, the swing is at about the level of the estimation error of the project, and there is very little upside to be sought. The business process for these projects needs to be designed for reliable delivery and safe base hits.
However, above the 100% (45 degree) line, the swing is bigger than the median: the home-run potential outweighs the safe base hit value. For example, a project in this region might have a median of $8 million and a swing of $250 million. In a portfolio that includes this project, a ten percent chance at a $250 million prize is a better bet than a 50 percent chance at the $8 million median. Projects where the swing is greater than the median need a business process that is organized around delivering an unreasonable upside.

But most companies construct business processes around reasonableness and delivering on the median. These processes ignore the upside potential in each opportunity, hamstring big opportunities with little goals, and produce little in the way of achievements.
To plot their projects on the swing chart, the CoP participants made credible estimates of the 10-50-90 value range of their projects. Each participant started with a good idea of the median value of their project. Working in pairs, each participant briefed his or her partner on a project, its median value, and the expected time frame for maturity of the resulting product.

Next, they looked for aspirational goals for each project. Each participant made a wildly optimistic estimate for the size (revenue potential or net present value) of their project; then their partner pressed them for reasons why the size could be larger, perhaps many times larger. When challenged in this way, people were able to envision the outside limit of what is possible. Each participant then estimated a 90th percentile number for their project, where there was only a one-in-ten chance the value could be higher.
We repeated the process to come up with wildly low estimates:
given that the product makes it to market, how small a value could it have?
This led to the 10th percentile number.
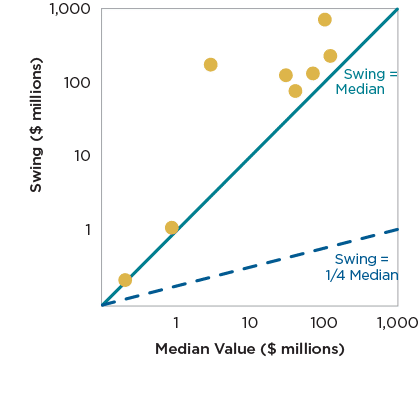
On the swing chart, the projects fell into the big upside region.
However, many participants admitted their firms managed their projects for the safe base case.

The CoP participants identified a number of roadblocks to thinking big, including:
The swing chart is a key tool in facing those fears. It shows the rewards that can be gained from addressing each roadblock and overcoming it. The method to do this is an upside exploitation plan.
Even when the project team understands the upside potential, too often they don’t follow through with the planning for upside exploitation.
An upside exploitation plan constructs a series of proof points that lead to the achievement of the higher value. Unlike milestones, proof points address go/no-go questions that determine whether to continue the project or pivot in another direction. Examples include:
Do you clearly understand the upside potential of each of your innovation opportunities? How much of your effort is focused on achieving the base for each opportunity and how much is devoted to growing to the upside?
In your development effort, will achieving the base help prove the case for upside exploitation and/or advance the upside directly? If so, it’s a formal part of an upside exploitation plan. However, if your plan to achieve the base case actually cuts off the possibility of exploiting the upside, it often makes more sense to put the base case aside and build an upside exploitation plan to score the home run.
To learn more about estimating value under uncertainty, creating proof points, and other strategic portfolio management topics, continue reading here.
NOTE: The SmartOrg Community of Practice is an annual gathering of strategic portfolio management practitioners, organized with the goal of letting them learn from one another’s journey in portfolio management.
This year, we hosted seven participants representing five organizations that cut across industries from high-tech materials to agroscience, from apparel to environmental conservation. As one of them said, “I learn more here than at any industry conference I go to, because here I talk to my peers about the work we all have in common.”